Measure and Improve Website Performance with Open Source Get started with Google Lighthouse and Chrome DevTools
With Google Lighthouse, developers can measure the performance of websites as well as the usability of web apps. The test conditions can be flexibly adapted.
Companies on the topic
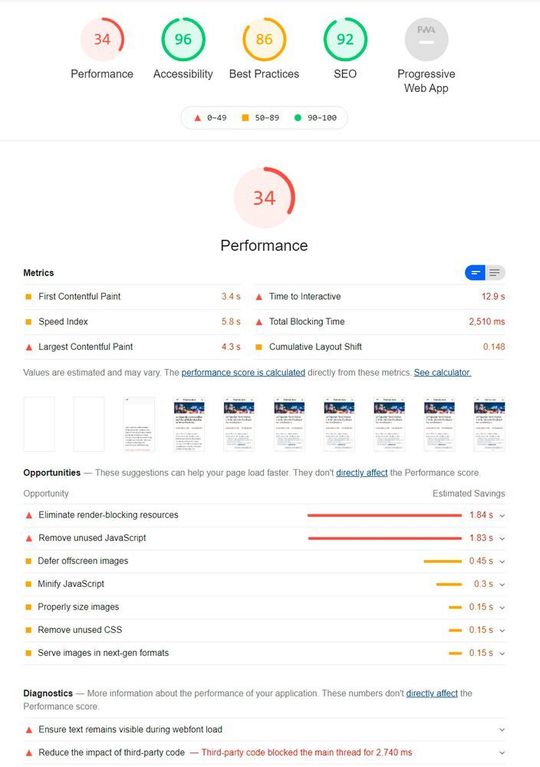 Google Lighthouse displays comprehensive reports when measuring websites.
(Image: Joos / Google)
Google Lighthouse focuses on Progressive Web Apps (PWA). However, other web applications can also be tested by the flexible test conditions. Since PWAs generally behave the same way on websites as apps on end devices, the performance must of course be as high as possible so that users also use the app. Here Lighthouse should help to detect and avoid bottle necks.
Use Google Lighthouse as a Chrome extension or in the CLI
 Google Lighthouse displays comprehensive reports when measuring websites.
(Image: Joos / Google)
Google provides Lighthouse as an open source tool for download. Lighthouse can also be operated via Google Chrome as an extension, alternatively a command line interface (CLI) is available. The browser extension is somewhat limited in its functionality, the CLI variant offers more options.
 Lighthouse can be called locally from the command line. This is done by adding Node on the computer.js needed.
(Image: Joos / Google)
In productive operation, both variants can certainly be used in parallel. For the CLI becomes Node.js In addition to Lighthouse needed on the computer. The Chrome extension also works without additional software. Google Lighthouse is also available for Mozilla Firefox. The add-on must be installed for use.
Testing websites and web apps with Lighthouse
Testing a website is relatively easy with the extension. After loading the website, you will be provided with [Strg]+[Shift]+[i] under Windows, or [CMD]+[Option (alt)]+[i] first called the developer tools, in it you will find the tab “Lighthouse”. To start the Lighthouse check, first set the desired category tick and click on “Generate report”.
Google Lighthouse then measures the page and displays results directly in the browser. In the upper range, the values for each individual measuring range can be seen over a point scale from 1 (bad) to 100 (good). Detailed details of the individual sub-items are shown below.
Developers can read out the results in detail to improve performance in individual areas and thus quickly identify and resolve performance issues. At the top of the report are summaries for different values. These include Progressive Web App, Performance, Accessibility, Best Practices and SEO.
The details for the individual measuring ranges are shown below in the report. Here you can also quickly see where performance problems are caused on a website. Important values are “First Contentful Paint”and” Time to Interactive”. These values quickly indicate when the website was set up and how long it takes for users to interactively access objects on the website.
For PWAs, there is a dedicated area that is activated when at least one PWA is used on a website. The report also includes recommendations on how to make better use of a PWA, whether the controls are optimally designed, and whether the objects of the PWA are properly configured, such as images.
Google Lighthouse for professionals
If you want to analyze pages comprehensively, you can hardly avoid the use of Google Lighthouse in the command line. This is initially also due to the fact that far more options are available via the CLI than with the extension.
Lighthouse uses an emulation of a Nexus 5x smartphone with Android for its measurement. With the option –disable-device-emulation no emulation is performed. The CLI also improves website performance using powerful hardware with the option –disable-cpu-throttling test.
In order to operate Lighthouse on a computer running Windows, you must first select the current version of Node.js can be installed. Lighthouse will then be installed as a global module:
npm install -g lighthouse
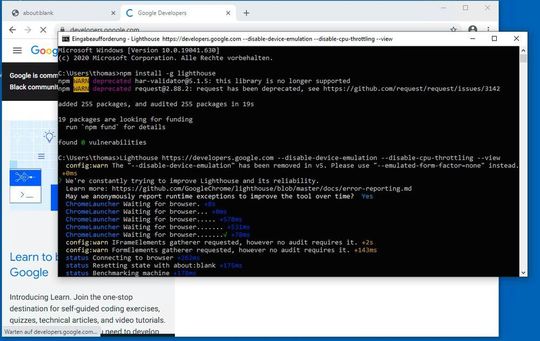 To use the Google Lighthouse CLI one comes around an installation via Node.js not around.
(Image: Joos / Google)
To test a website after installation, Lighthouse is called and the website and the desired parameters are specified as an option, for example with:
Lighthouse https://developers.google.com --disable-device-emulation --disable-cpu-throttling --view
A more detailed help shows the tool with “lighthouse — help”. Using the three-point menu in the top right corner of a Lighthouse report, you can choose between saving reports as HTML files or sharing them as gist. Reports can also be printed here. Saving as a JSON file is also possible here.
Reports can also be shared as gists. To do this, a locally started report is first opened via “Save as Gist” in the Lighthouse Report Viewer. Access must still be allowed for the first time.
Chrome DevTools and Google Lighthouse
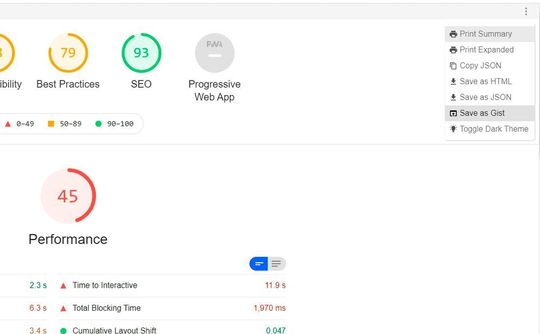 Lighthouse reports can of course also be saved.
(Image: Joos / Google)
Most web developers outstaffing work in parallel with Chrome DevTools when it comes to website optimization. The tools are directly integrated into the Google Chrome browser and help optimize websites. The DevTools work with Lighthouse, for example when it comes to exporting a measurement report and sharing it with other developers.
Exported reports can be viewed with the Lighthouse Report Viewer, which is also available free of charge. The DevTools are loaded, for example, when the menu item “Examine” is selected on a website in Google Chrome via the context menu.
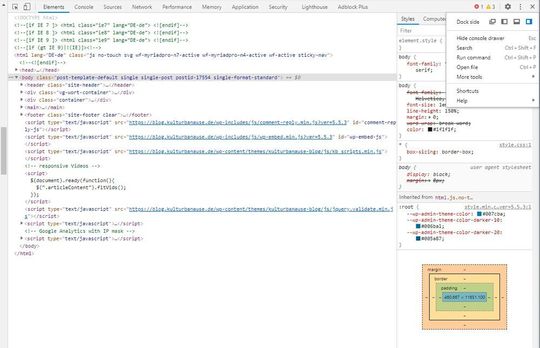 Using the Chrome DevTools.
(Image: Joos / Google)
The HTML code of a page can be seen via the menu item “Elements”. However, the DevTools do not show the source code of the page, but the code that Google Chrome interprets. This does not necessarily have to be the same code. Here you can also check the CSS code of a page. It is possible to check JavaScript elements via “Console”. Using the menu with the three dots in the upper right corner, the DevTools can be positioned elsewhere.
(ID:47036011)


